2024 Port Congestion Analysis: A Comprehensive Review of Global Dwell Time Trends for Imports and Exports
Port congestion continues to be a significant concern in global trade as supply chains strive to recover from pandemic-related disruptions while adapting to geopolitical shifts and fluctuating demand. Understanding dwell times for imports and exports at key global ports offers a clear picture of where delays are most severe and where improvements are being made. In this report, we explore the average and median dwell times across major global ports, dividing our analysis between imports and exports for greater clarity and actionable insights.
Benefits of Real-Time Congestion Tracking for Decision-Makers
- Agility in Operations: Real-time updates enable quick responses to disruptions, allowing rerouting or rescheduling to avoid delays. This proactive approach minimizes penalties and keeps the supply chain moving.
- Cost Control: Real-time data helps avoid extra costs like demurrage and detention fees by steering clear of congested ports. It also supports better contract negotiations with carriers, using current congestion insights.
- Smarter Carrier and Route Choices: Directors can optimize transport decisions based on real-time conditions, reducing lead times and improving service reliability. This data also supports flexible multi-modal transportation strategies.
- Proactive Customer Communication: Real-time insights allow companies to notify customers of delays and set realistic delivery expectations, enhancing transparency and satisfaction.
- Strategic Planning: Combining real-time and historical data uncovers patterns, guiding long-term supply chain improvements like digital upgrades or strategic partnerships.
Real-time tracking turns reactive supply chain management into a proactive strategy, boosting efficiency and resilience.
Why Separate Import and Export Dwell Time Analysis Matters
Ports worldwide face unique challenges when handling imports versus exports, driven by factors such as terminal infrastructure, labor availability, trade policies, and regional demand. Analysing dwell times separately allows for a targeted assessment of port performance, helping supply chain professionals identify bottlenecks and optimize logistics strategies. This 2024 report breaks down the latest dwell time data, offering detailed insights across the United States, Europe, and Southeast Asia.
Imports: Navigating Congestion Challenges
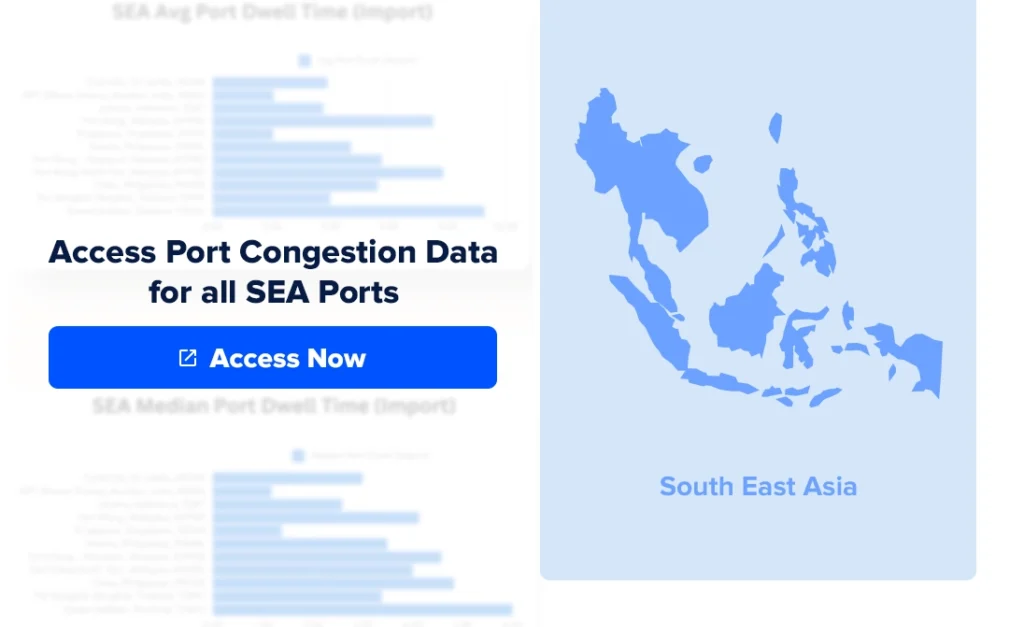
1. Southeast Asia: A Hub with Mixed Import Dwell Time Performance
- Port of Singapore (SGSIN): Singapore continues to lead globally with an average import dwell time of 4.2 days and a median of 3.1 days, reflecting its status as a transshipment hub with highly optimized processes.
- Port of Colombo (LKCMB): Colombo shows stable import dwell times, averaging 7.8 days with a median of 5.4 days. Despite regional disruptions, the port manages to maintain balanced operations due to recent capacity enhancements.
- JNPT (Nhava Sheva, India INNSA): India’s largest port records an average import dwell time of 8.9 days with a median of 6.7 days, a significant improvement from previous years, attributed to ongoing infrastructure upgrades and process digitization.
- Port Klang (MYPKG): Import dwell times at Port Klang vary significantly across its terminals. Westport records an average of 10.3 days while North Port performs better at 7.1 days, highlighting the need for harmonized operations across the port complex.
- Port of Manila (PHMNL): Manila remains a congestion hotspot with import dwell times averaging 12.5 days and a median of 9.9 days, indicating persistent infrastructure and capacity challenges.
To get full insight for Southeast Asia Ports, click the button below
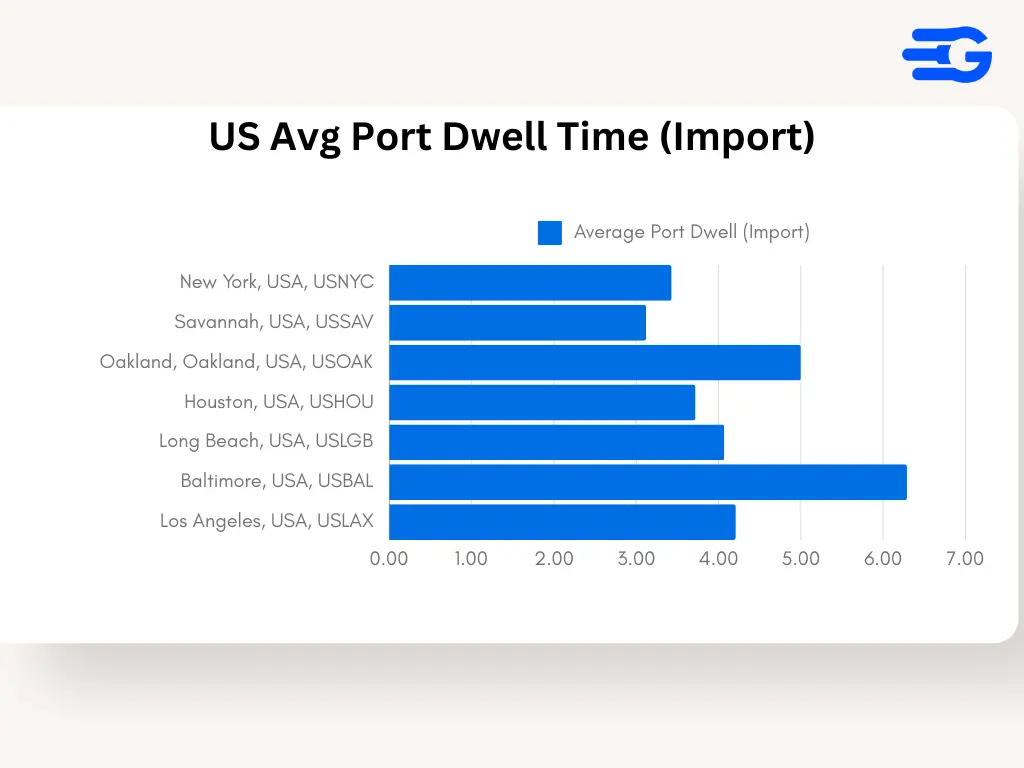
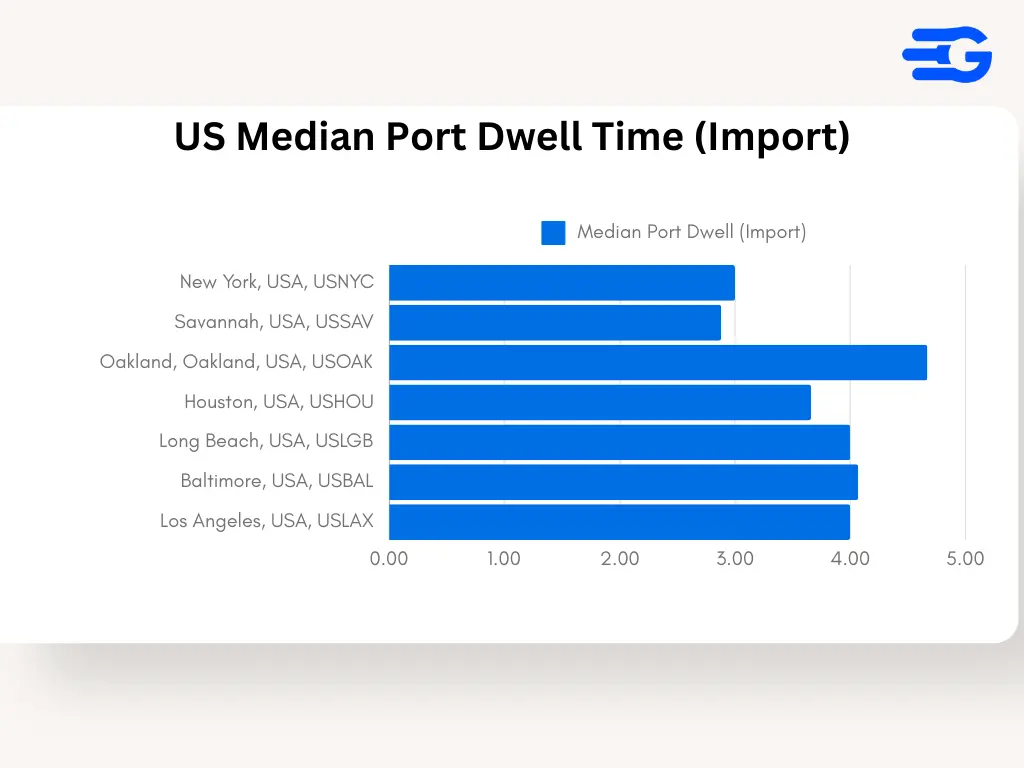
2. United States: Import Dwell Times Across Key Ports
- Port of Baltimore (USBAL): Baltimore shows a high average import dwell time of 17.3 days with a median of 12.6 days, reflecting operational bottlenecks and infrastructure limitations. This suggests frequent delays in clearing inbound containers, causing significant congestion.
- Port of Long Beach (USLGB): Long Beach records an average import dwell time of 14.7 days and a median of 10.3 days. The port’s heavy reliance on trans-Pacific trade makes it prone to prolonged congestion, especially during peak seasons.
- Port of Savannah (USSAV): Savannah’s import dwell time averages 12.2 days with a median of 9.4 days, reflecting the ongoing strain from rising container volumes on the East Coast. The port’s expansion efforts have helped marginally reduce congestion but are still insufficient to keep up with demand.
- Port of Oakland (USOAK): Oakland demonstrates relatively better import efficiency with an average dwell time of 9.8 days and a median of 8.1 days. Investments in terminal automation and infrastructure upgrades have contributed to smoother operations.
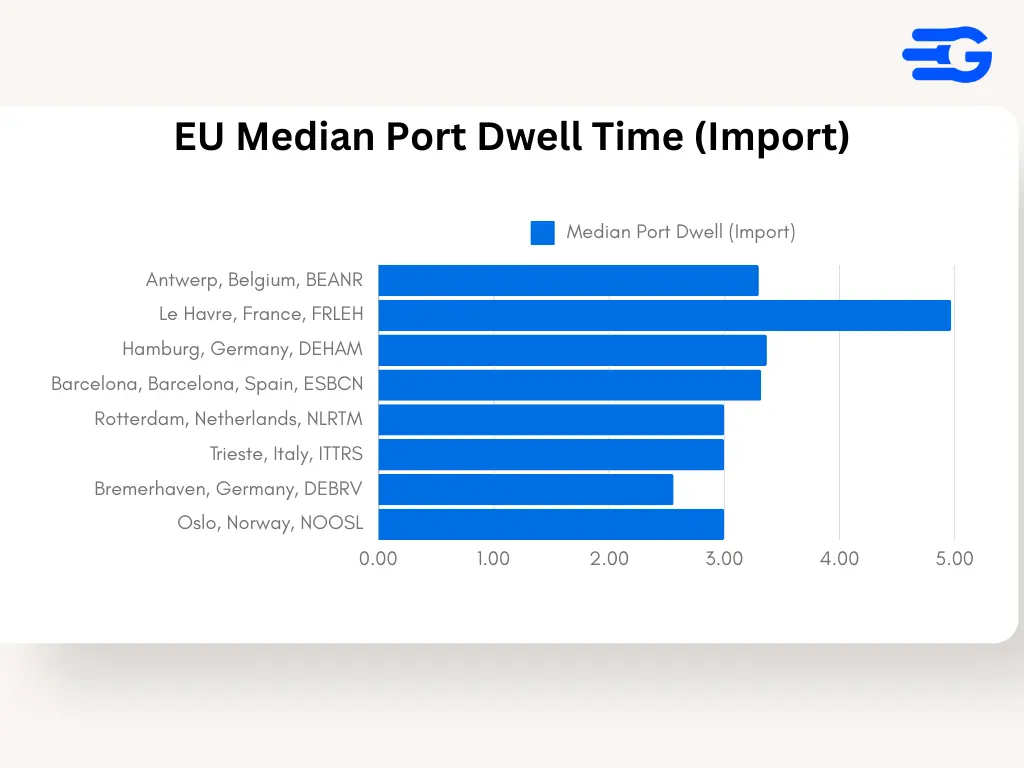
3. Europe: Handling Import Flows Amid Complex Trade Dynamics
- Port of Antwerp (BEANR): Antwerp shows consistent performance with an average import dwell time of 11.4 days and a median of 8.9 days. Despite handling high volumes, the port’s advanced logistics systems enable stable operations.
- Port of Rotterdam (NLRTM): Rotterdam remains a model of efficiency in Europe, with import dwell times averaging 9.3 days and a median of 7.8 days. The port’s digitization initiatives and robust connectivity make it resilient even during peak periods.
- Port of Barcelona (ESBCN): Barcelona struggles with import congestion, reporting an average dwell time of 13.6 days and a median of 10.4 days. The port’s location as a Mediterranean gateway brings in high volumes but also exposes it to bottlenecks.
- Port of Bremerhaven (DEBRV): Bremerhaven shows excellent performance with import dwell times averaging 8.2 days and a median of 6.5 days. Its efficient rail and road connectivity contribute to quick container clearance and reduced storage times.

Exports: Delays and Operational Bottlenecks
1. Southeast Asia: Export Operations and Efficiency Gaps
- Port of Singapore (SGSIN): Singapore remains the gold standard with an average export dwell time of 2.95 days and a median of 2.07 days, demonstrating its capability to handle high export volumes with minimal delays.
- Port of Colombo (LKCMB): Colombo’s average export dwell time is 5.06 days with a median of 3.83 days, reflecting balanced operations despite the port’s critical role in South Asia’s trade routes.
- JNPT (Nhava Sheva, India INNSA): JNPT shows improved export dwell times, averaging 4.12 days with a median of 3.64 days, supported by recent upgrades in cargo handling facilities and digital tracking systems.
- Port Klang (MYPKG): Export dwell times vary across terminals at Port Klang, with Westport averaging 6.59 days and North Port performing better at 4.7 days, highlighting the ongoing need for process alignment across different terminals.
- Port of Manila (PHMNL): Manila’s export operations face significant congestion, with average dwell times of 7.17 days and a median of 6.85 days, underscoring the need for enhanced infrastructure and better management practices.
To get full insight on Export Dwell Time, click the button below

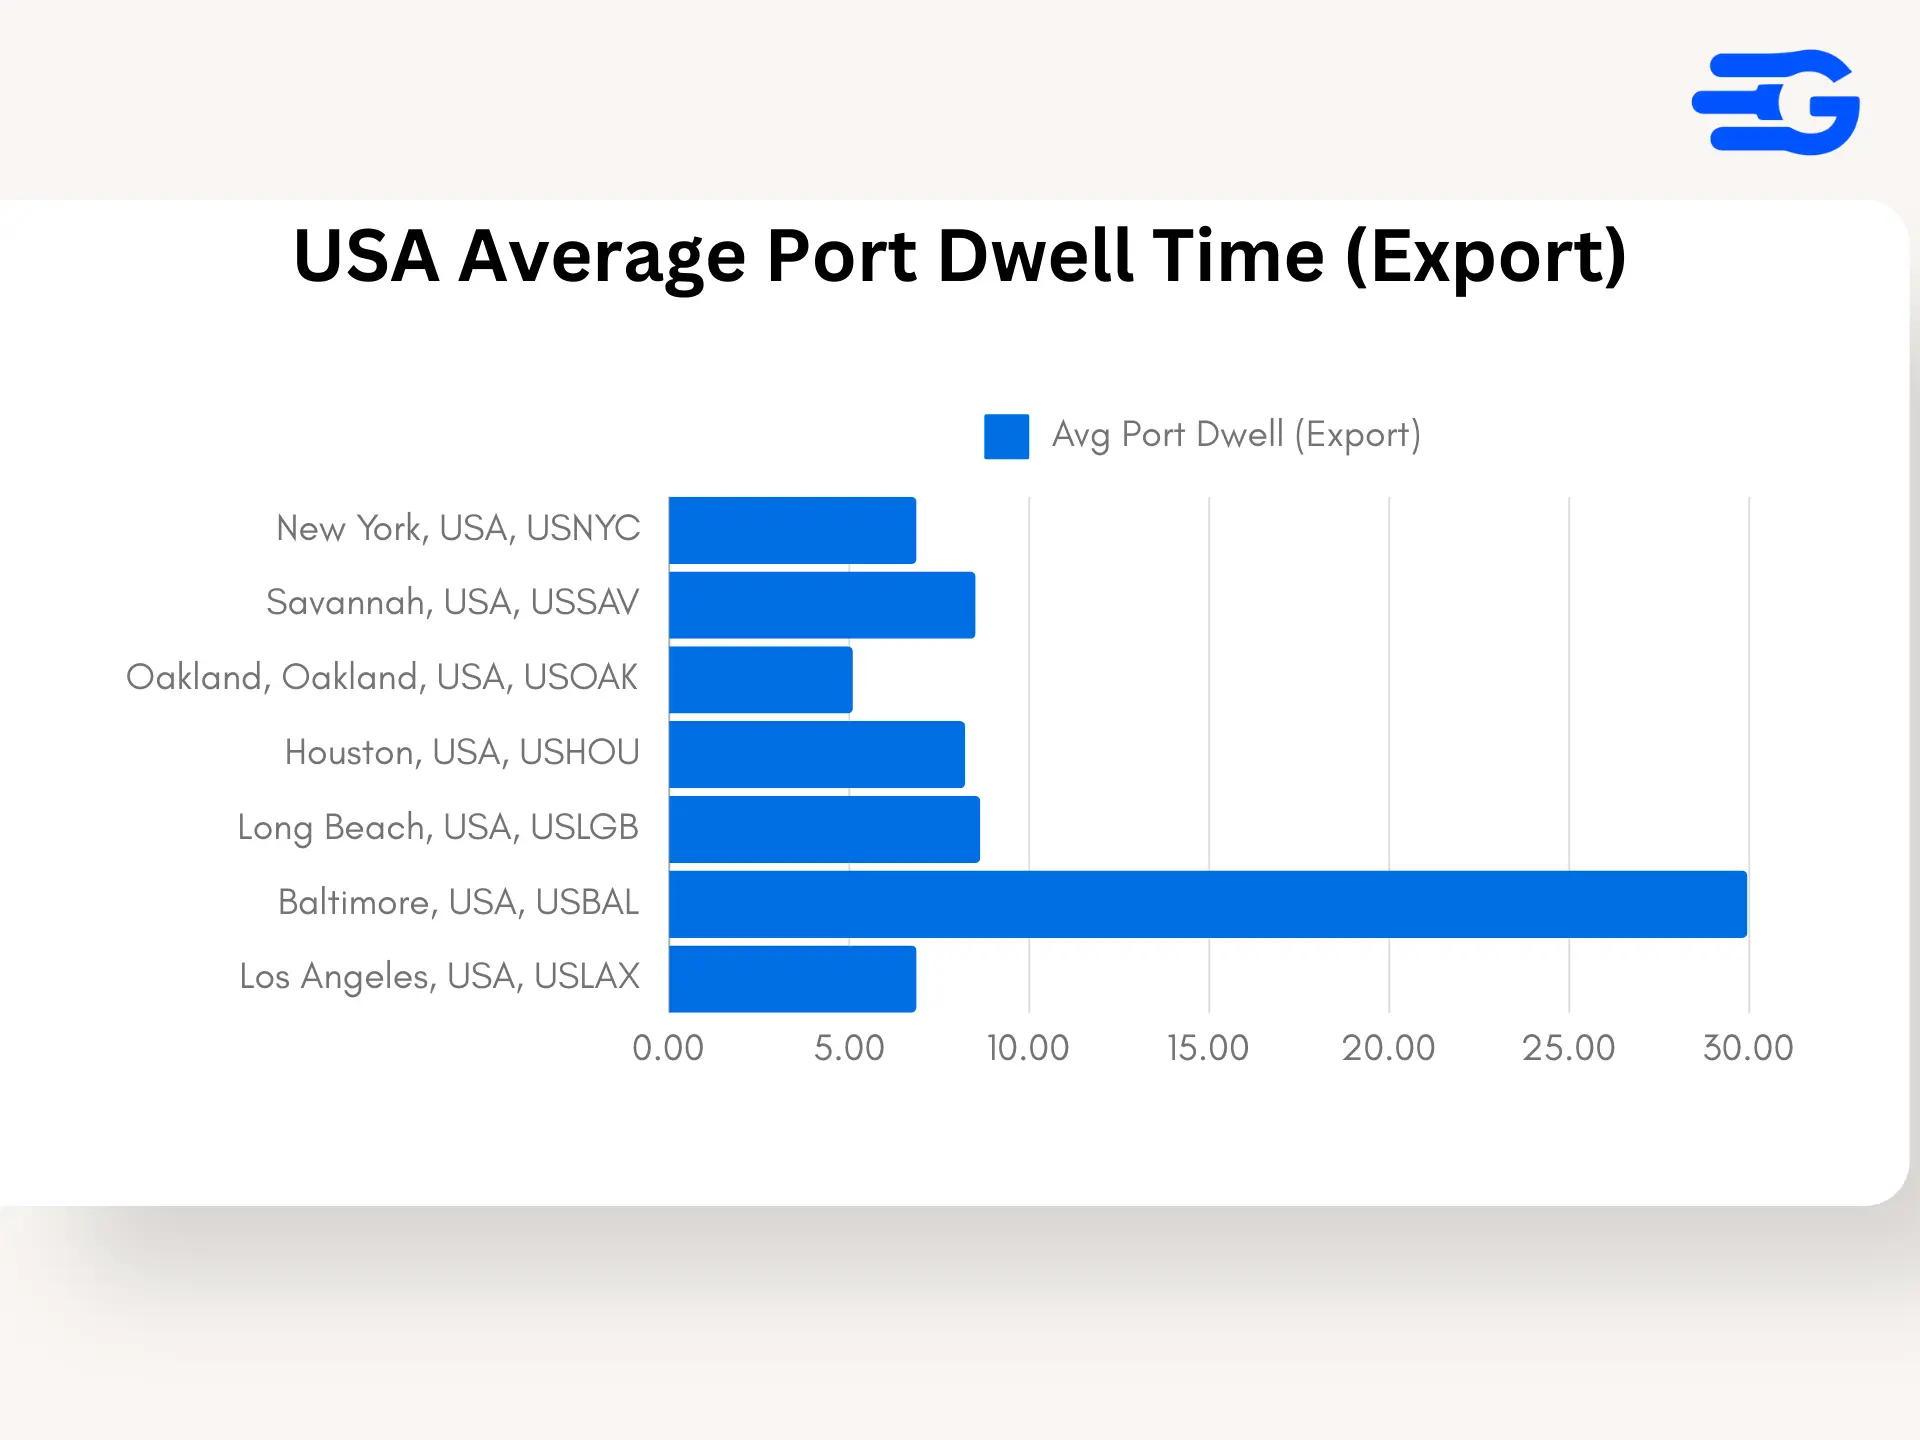
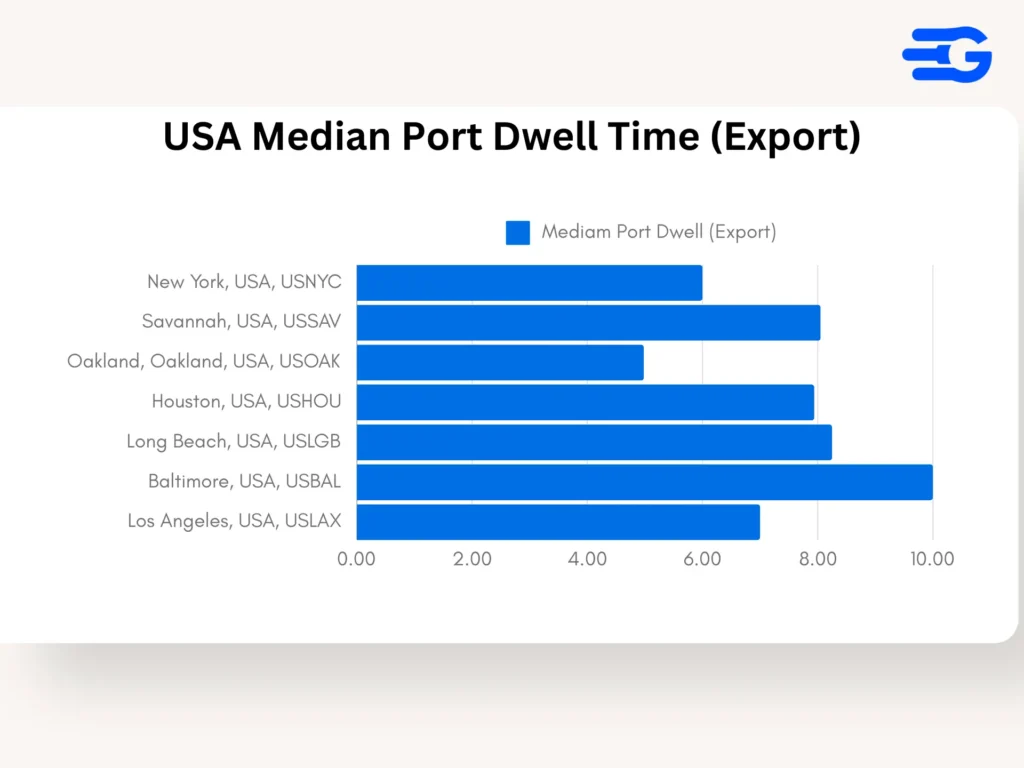
2. United States: Export Dwell Times at Major Ports
- Port of Baltimore (USBAL): Baltimore faces significant delays in export operations, with an average dwell time of 29.95 days and a median of 10 days. The disparity suggests periodic extreme delays, possibly due to capacity issues and labor shortages.
- Port of Long Beach (USLGB): Long Beach’s export dwell times reflect ongoing challenges, with an average of 8.64 days and a median of 8.25 days, driven by heavy outbound demand and high container throughput.
- Port of Savannah (USSAV): Savannah reports an average export dwell time of 8.51 days with a median of 8.05 days, reflecting its key role in East Coast exports despite facing consistent pressure on its resources.
- Port of Oakland (USOAK): Oakland performs better with an average export dwell time of 5.1 days and a median of 4.98 days, thanks to recent infrastructure investments aimed at streamlining outbound cargo operations.
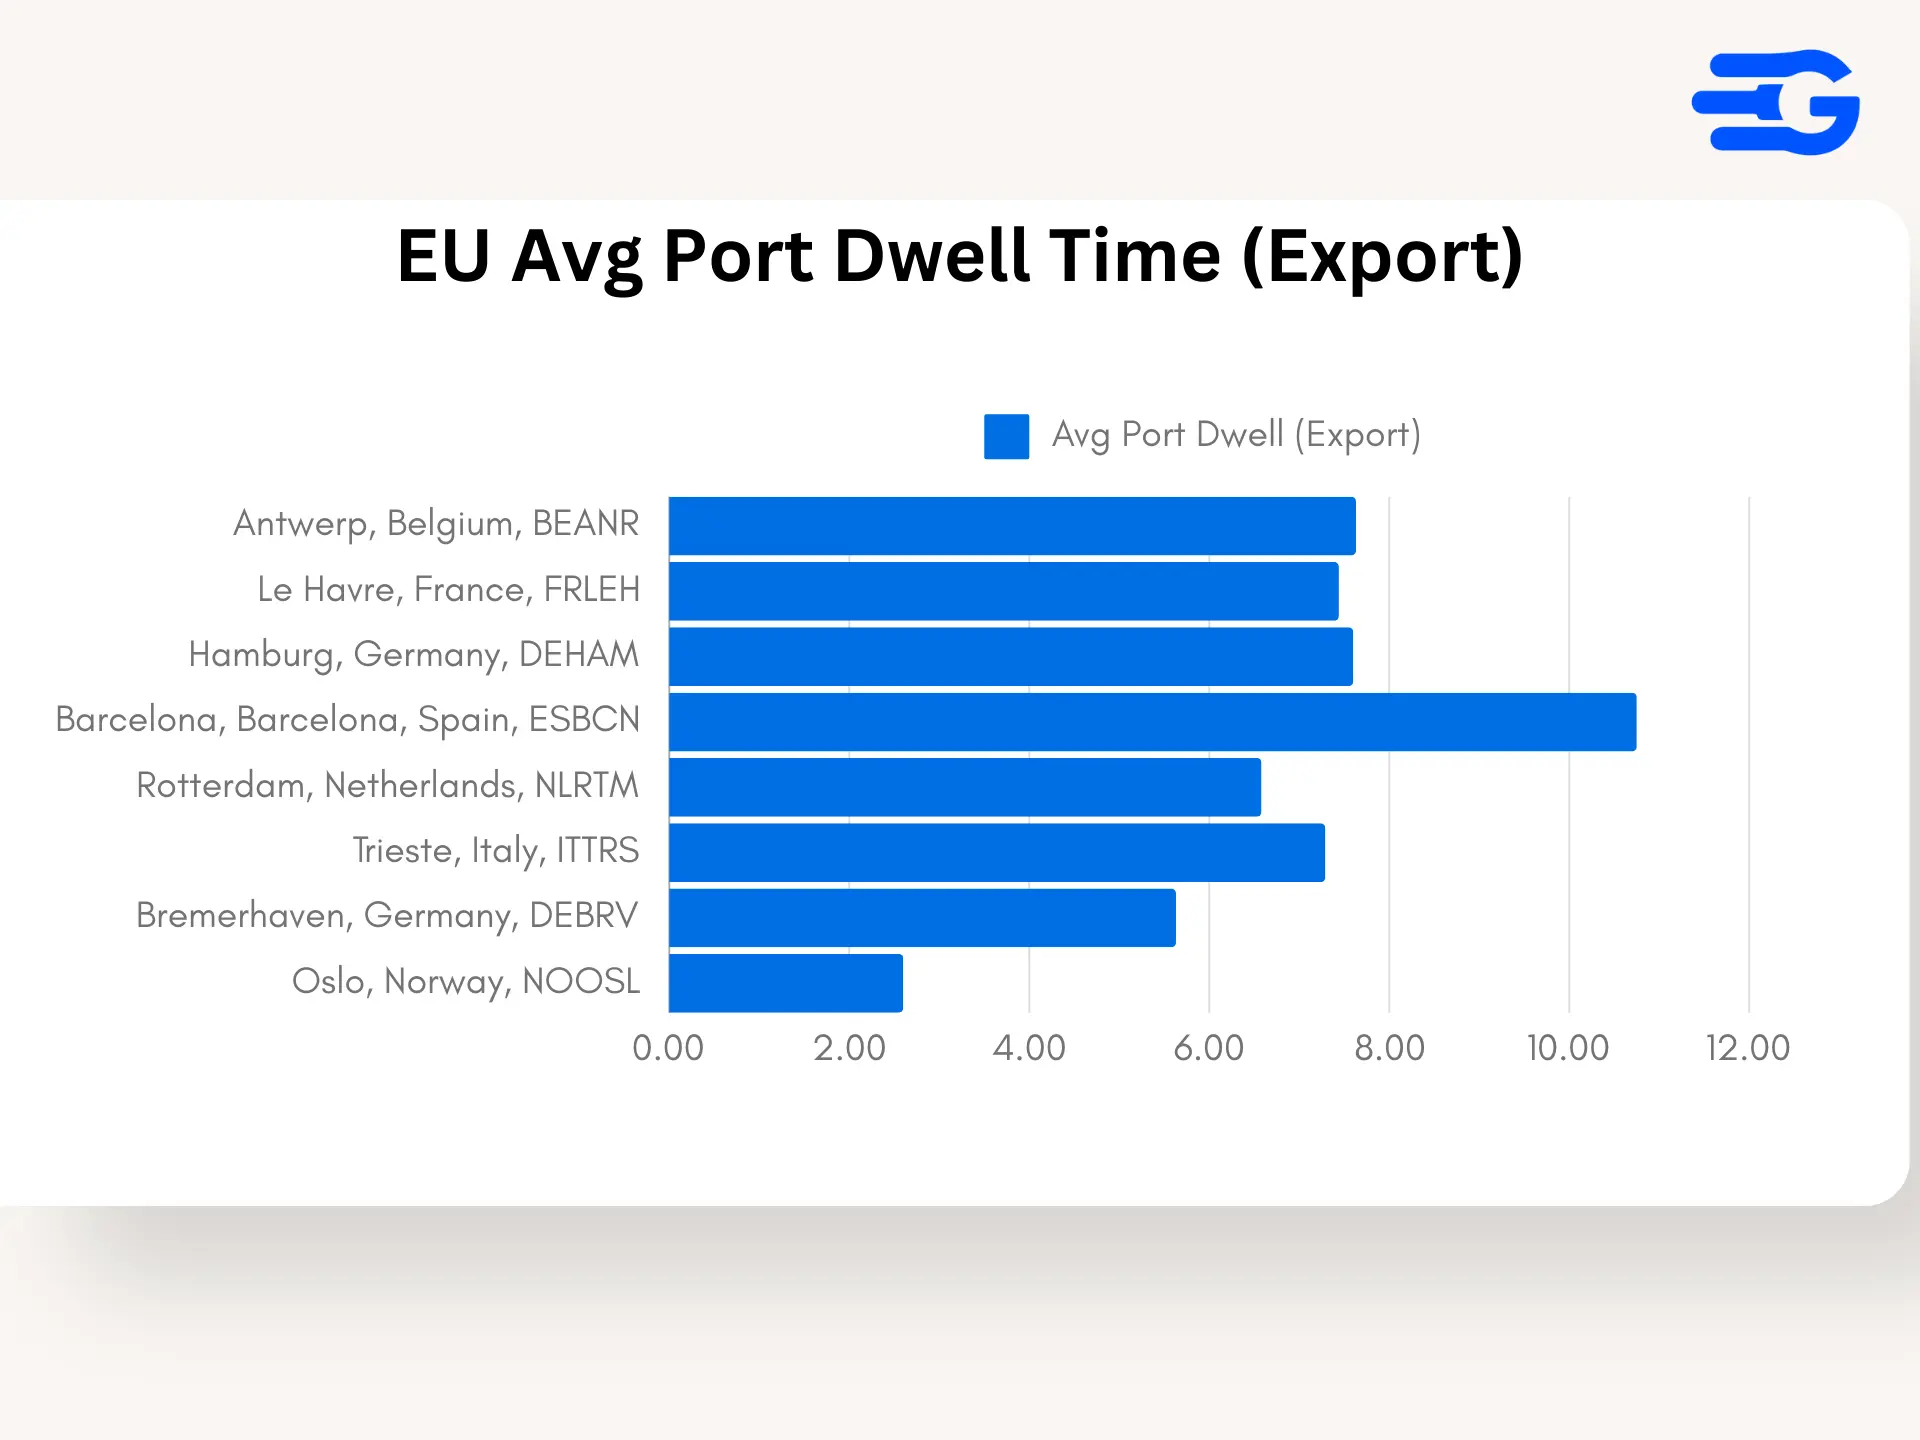
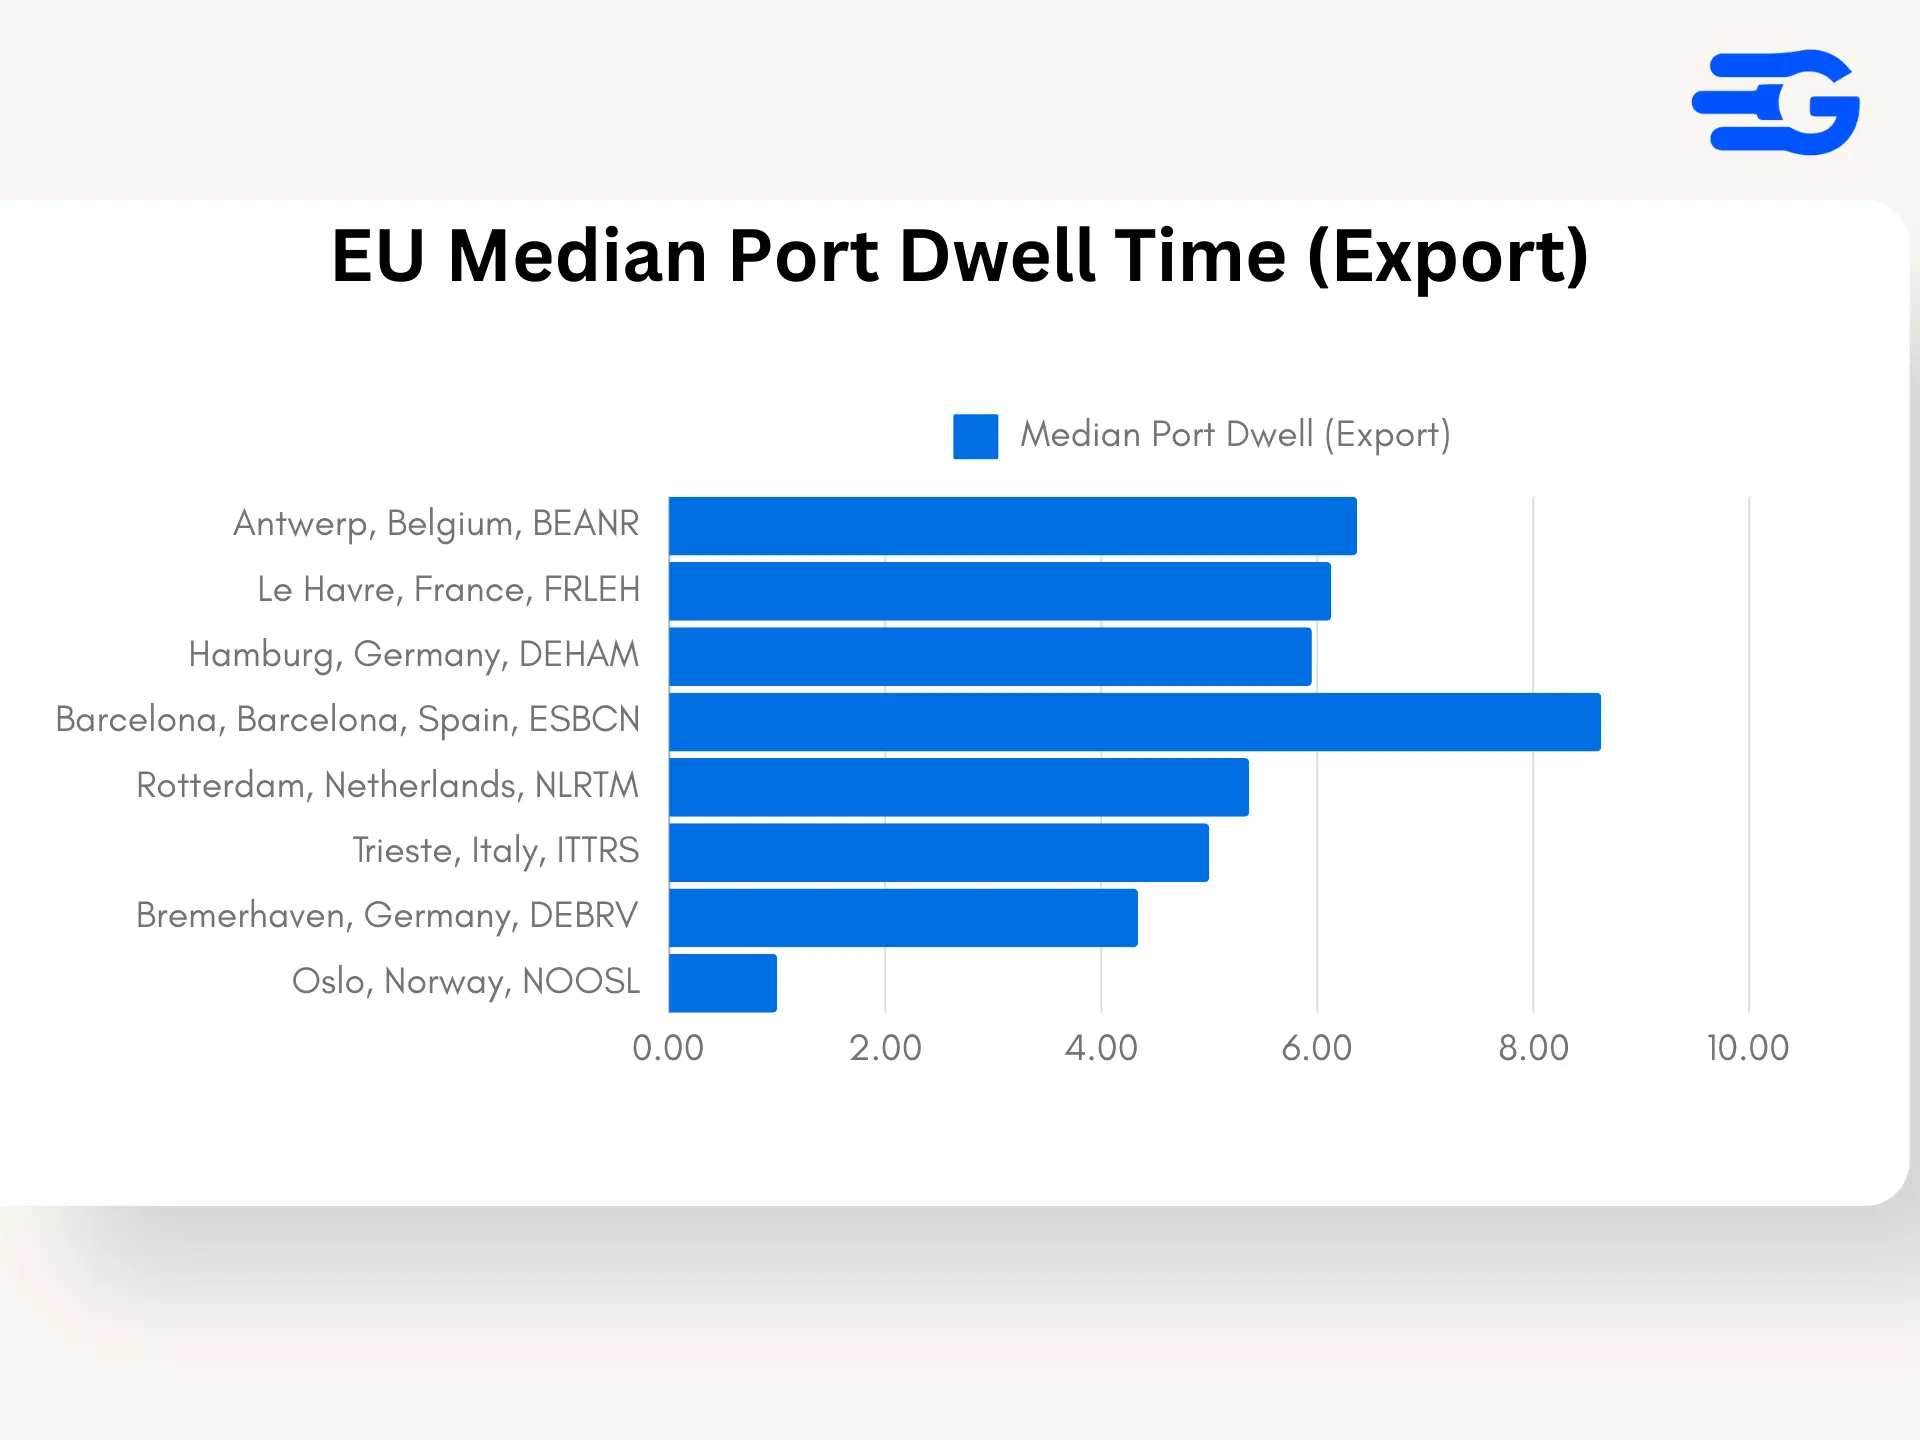
3. Europe: Managing Export Flows Amid Economic Pressures
- Port of Antwerp (BEANR): Antwerp’s average export dwell time is 7.63 days with a median of 6.37 days, indicating a moderate level of congestion, driven by high export volumes and occasional logistical slowdowns.
- Port of Rotterdam (NLRTM): Rotterdam maintains strong performance, with export dwell times averaging 6.58 days and a median of 5.37 days, supported by advanced cargo handling systems and efficient hinterland connections.
- Port of Barcelona (ESBCN): Barcelona continues to face high export congestion, with an average dwell time of 10.75 days and a median of 8.63 days, highlighting the need for further capacity expansion and process optimization.
- Port of Bremerhaven (DEBRV): Bremerhaven shows efficient export handling, averaging 5.63 days with a median of 4.34 days, aided by its integrated logistics network and streamlined customs processes.
Key Trends Observed in 2024
Diverging Efficiency in Southeast Asia: While ports like Singapore excel with optimized operations, others like Manila struggle with persistent bottlenecks, emphasizing the need for capacity and infrastructure improvements.
Automation and Technology Adoption: Ports that have heavily invested in automation and digitalization, such as Singapore and Rotterdam, consistently report lower dwell times, leading to greater overall efficiency.
Economic and Geopolitical Factors: European ports face mixed results as they navigate economic challenges and shifting trade routes. Bremerhaven stands out for maintaining low dwell times amid these pressures.
Take Control with GoComet
The 2024 analysis of global port dwell times underscores significant variations in how ports handle imports versus exports, creating unique challenges for logistics teams worldwide. GoComet’s Port Congestion Tracker offers the tools needed to address these challenges with precision. Analyzing over 45,000 containerized shipments each month, GoComet provides real-time data on delays across major ports in the U.S., EU, EMEA, and SEA regions.
Powered by GoComet’s advanced machine learning, the tracker accurately calculates congestion levels by considering vessel turnaround times, time spent in port queues, and container gate-out times. These real-world metrics offer an accurate picture of port congestion, empowering you to avoid bottlenecks, optimize routes, and keep your customers well-informed.
By choosing GoComet, logistics leaders gain a powerful advantage—real-time visibility that enhances operational efficiency and minimizes disruptions in supply chains. Ready to gain control over your shipping routes?
Discover GoComet’s Port Congestion Tracker and elevate your logistics planning.